Venture · Business Intelligence
Group performance across every business, in one place.
- Group
- Hamd Holdings
- Year
- 2026
- Markets
- UAE, India
- Status
- Private platform
The brief
My role
Product owner. I defined what the morning view has to answer.
Overview
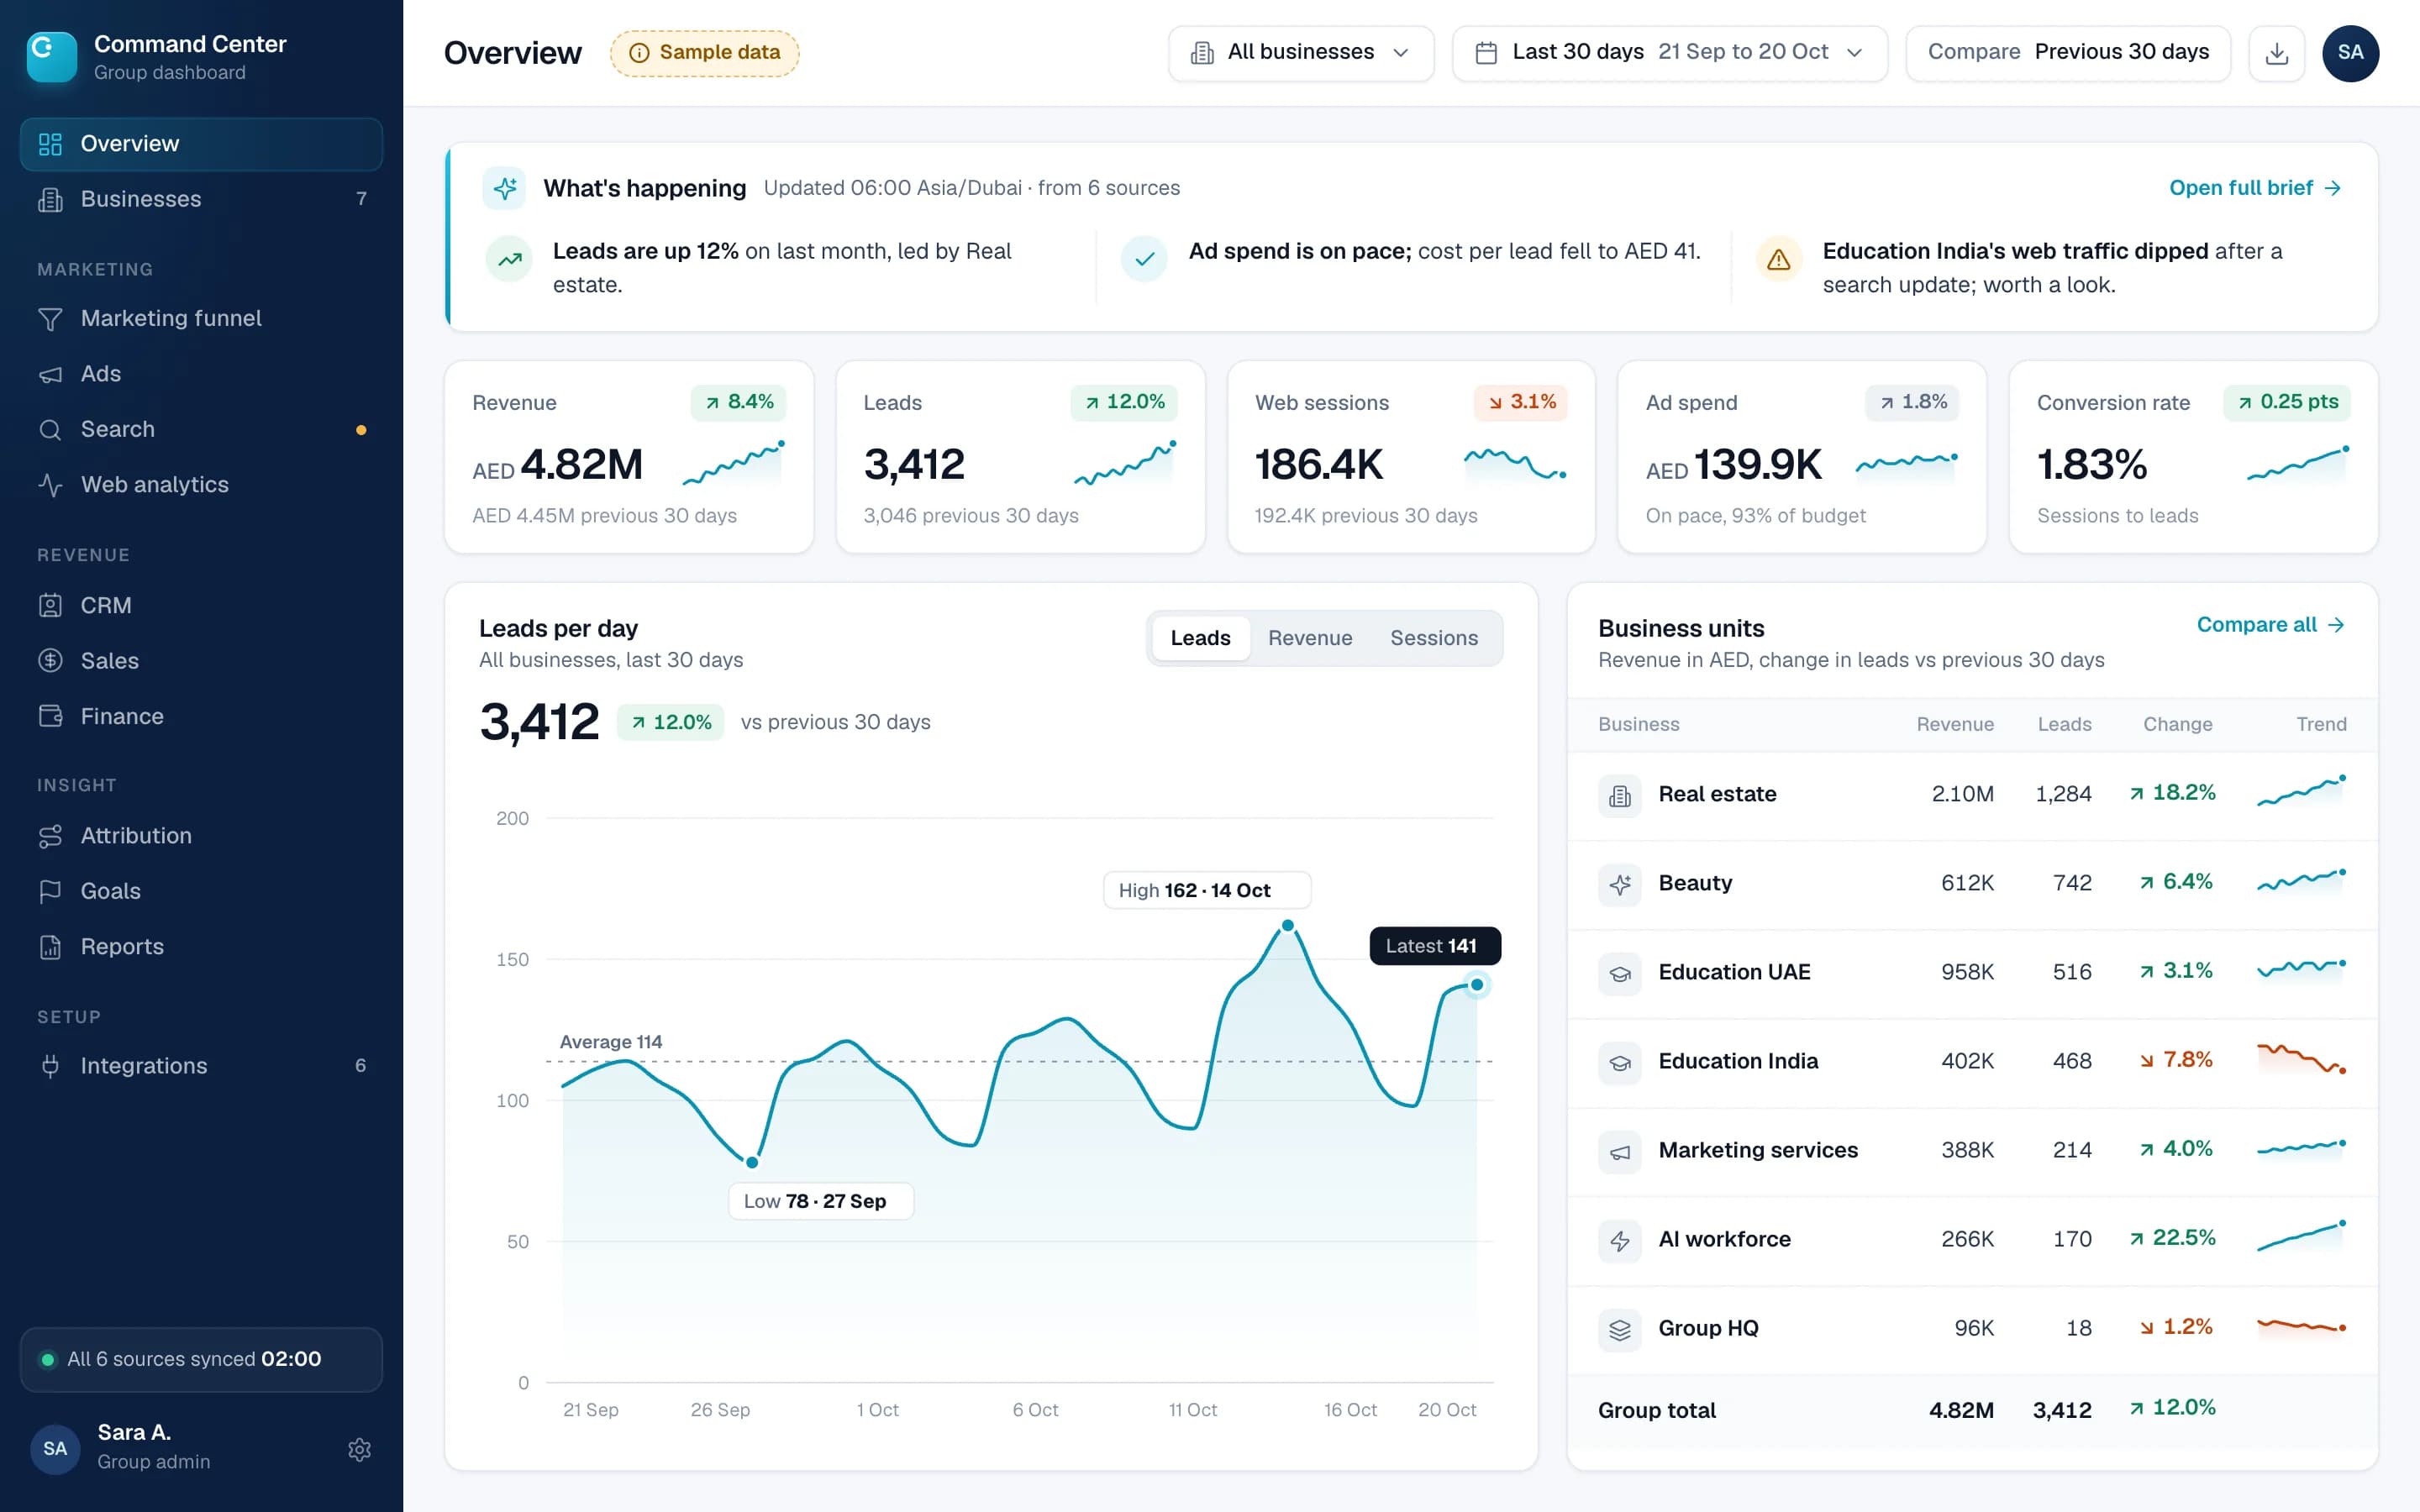
The Command Center pulls finance, marketing, ads, web, search, CRM and sales data for every company in the group into one dashboard, with a 30-second summary on top and a traceable drill-down behind every number.
The challenge
Seven business units, a dozen tools and two currencies meant decisions were made from screenshots and spreadsheets. I wanted one place that answers how the group is doing, in plain English, every morning.
7
Business units in one view
15
Data connectors
19
Dashboard pages
5
Attribution models
What we built
We connected analytics, search, ads, CRM and accounting sources, converted everything to dirhams, and built a page for every business and every function. Each page opens with a written brief, and every chart states its own high, low and average.
The pieces that make it work, for the people who use it every day.
A brief on every page
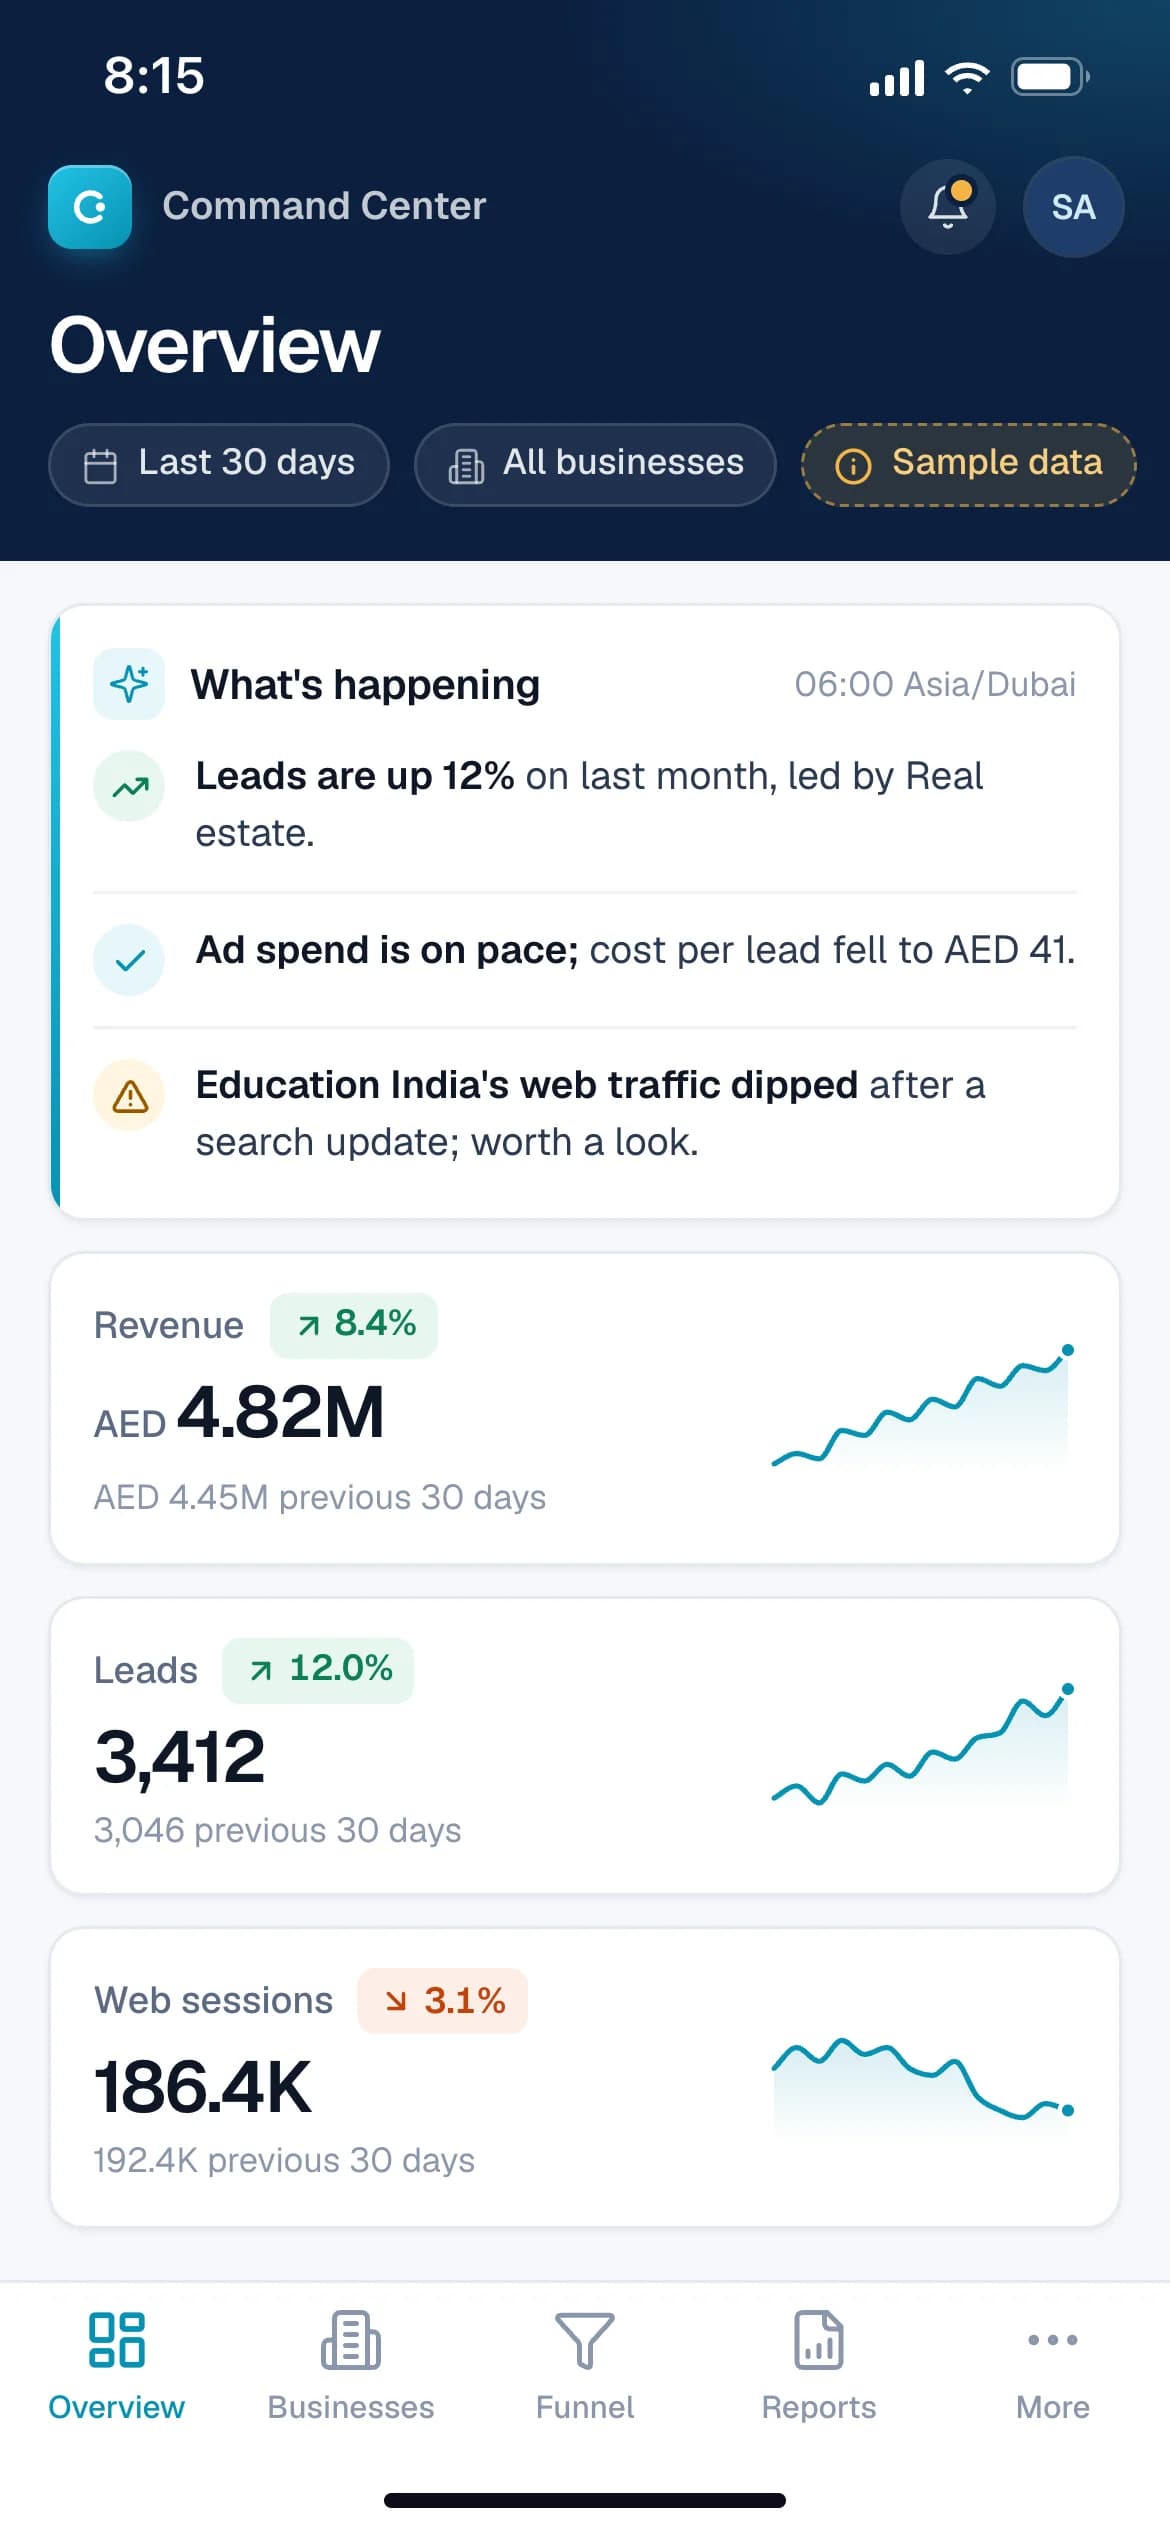
A plain-English 'What's happening' summary before any chart.
Every source connected
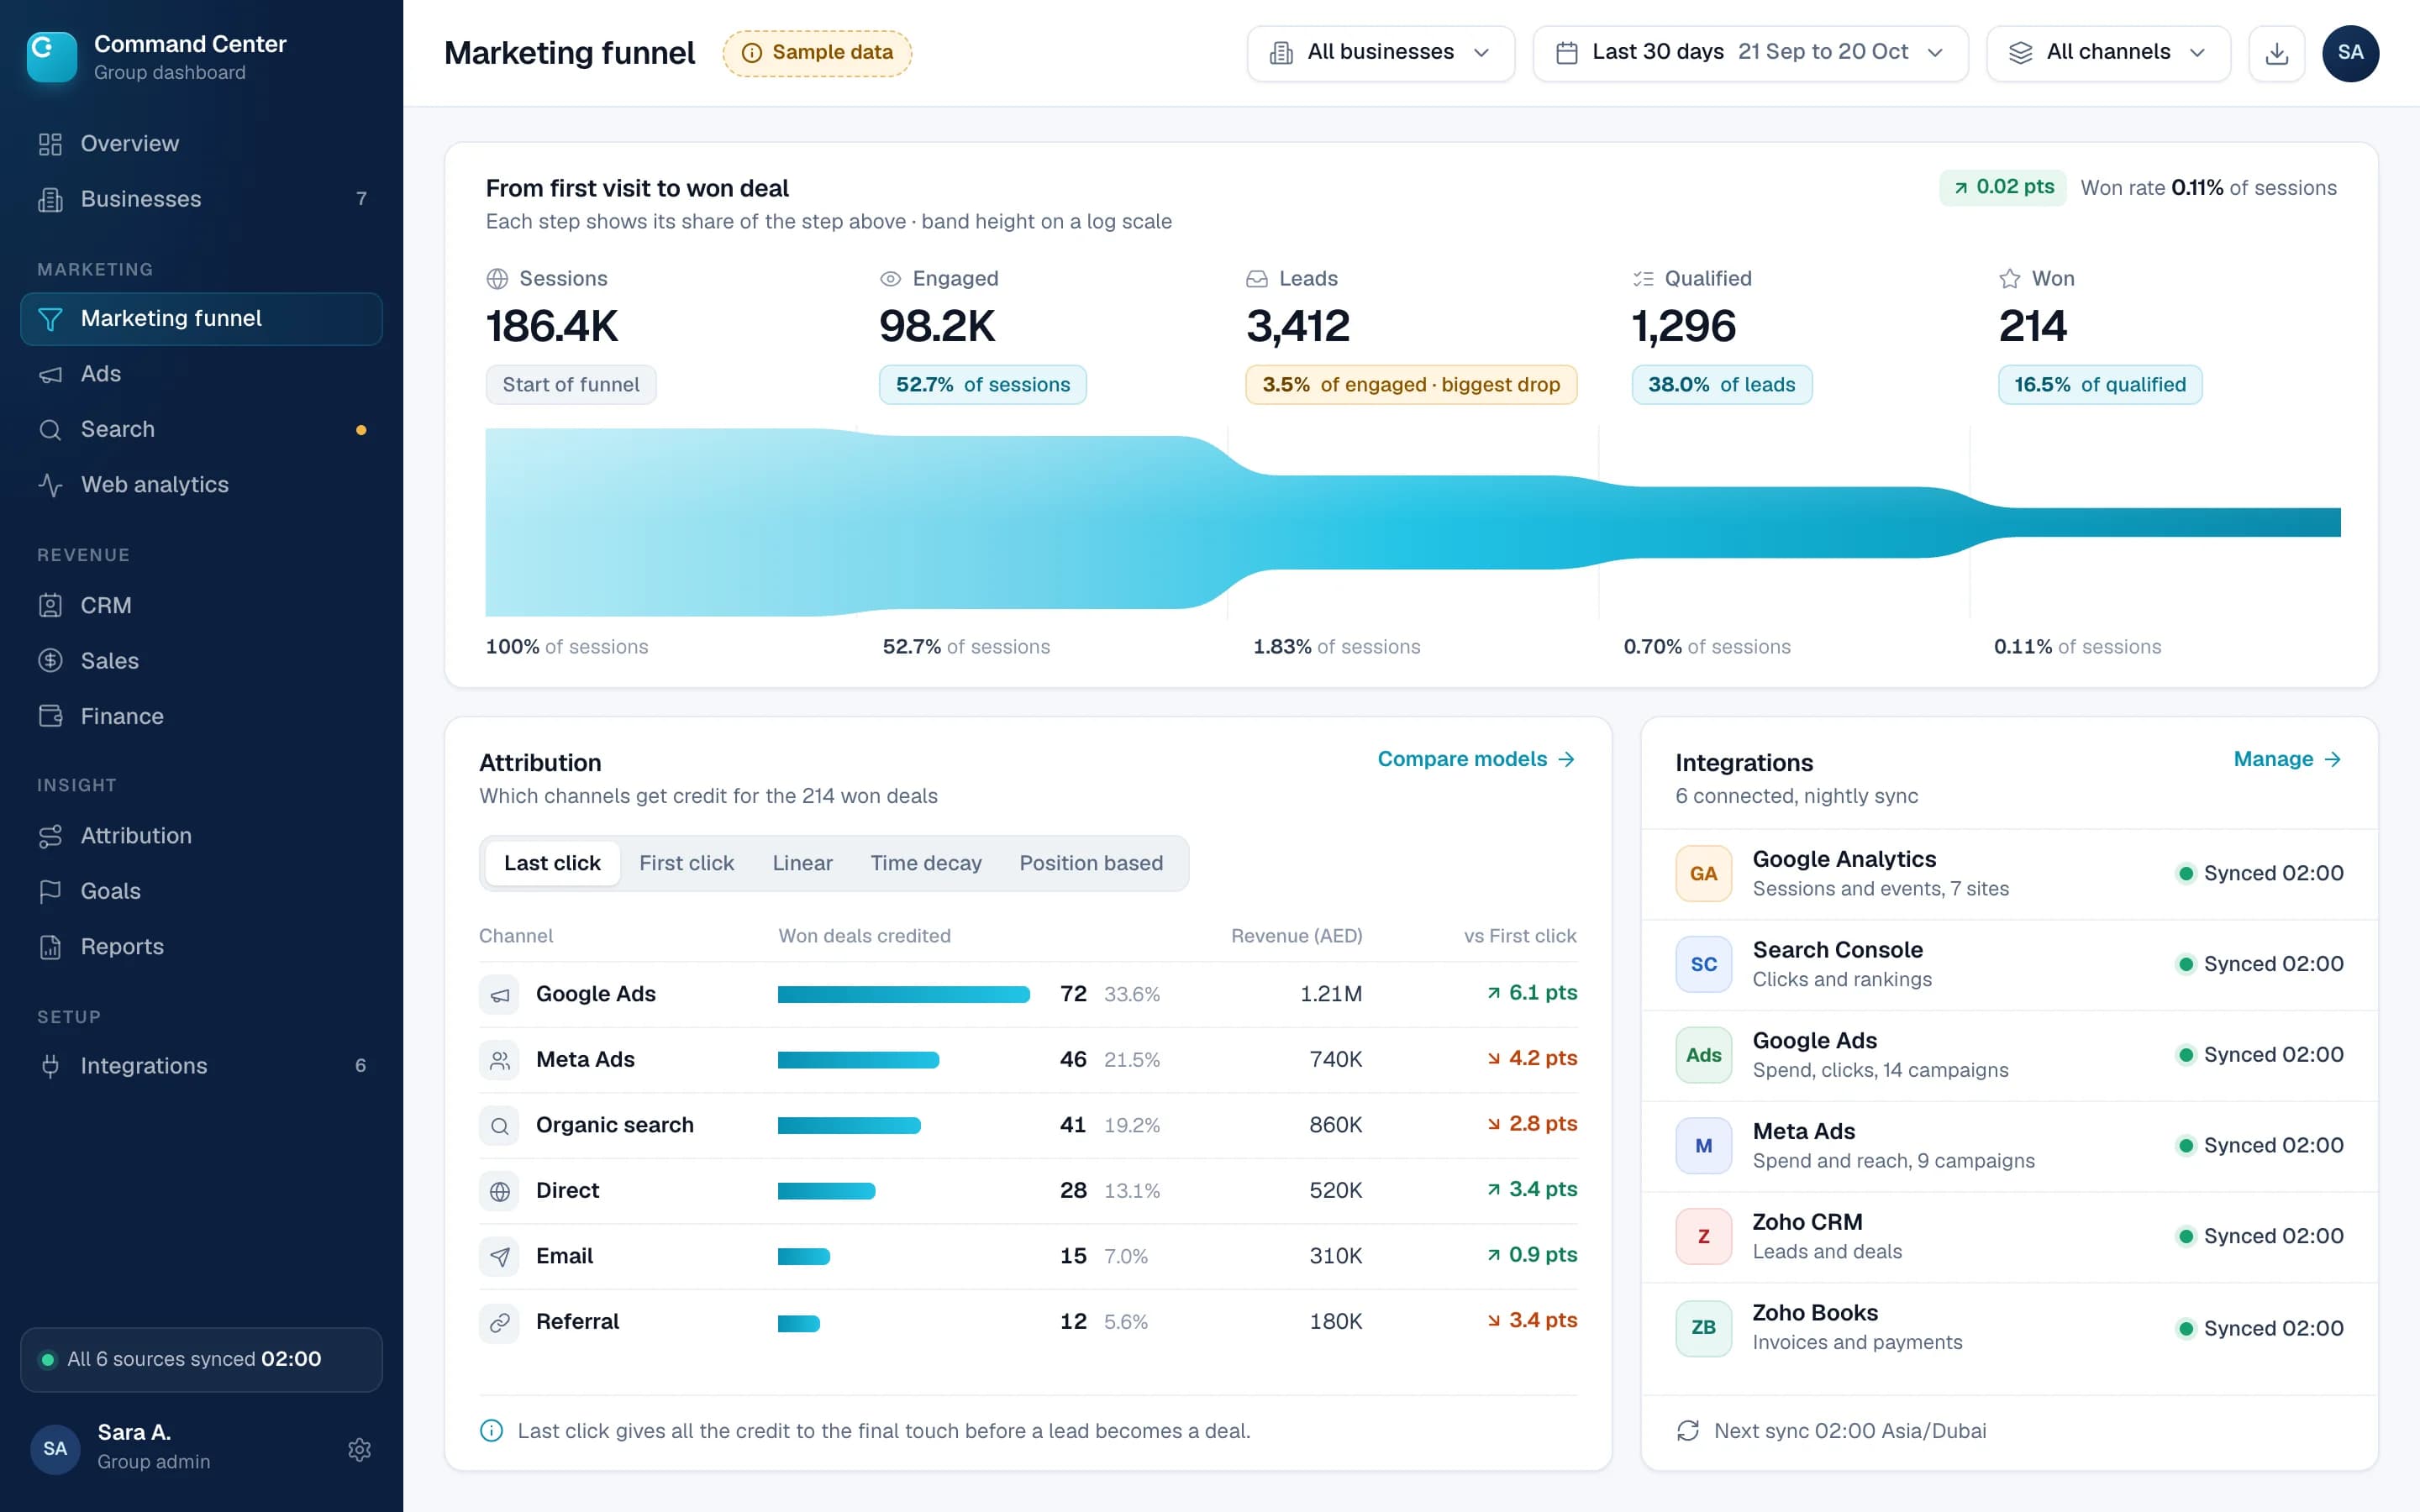
Google Analytics, Search Console, Google and Meta Ads, Zoho CRM and Zoho Books, synced daily.
Goals and forecasts
Goal pace, backtested forecasts and alerts when something drifts.
Attribution
Five attribution models to compare what really drives leads.
Charts that explain themselves
Every chart states its high, low, average and latest value.
Reports on demand
PDF, Excel and CSV exports, with filters saved in the link.
This is a private platform, so the screens are an illustrative mock-up with sample data.
How it came together
- 01
Questions first
Started from the questions a group founder asks every morning.
- 02
Connectors
Built an adapter for each source and tested it against live data.
- 03
Clarity
Rewrote every page so it leads with a written takeaway, not a chart.
- 04
Rollout
Launched for the leadership team with role-based access.
Built with
Markets and languages
The outcome
One trusted view of the whole group, so the morning starts with decisions instead of spreadsheets.
Real Estate
Rocky Real Estate
